This article is all about the project I built, open-source, self-hostable lightweight Google Analytics alternative. I wanted to understand how things work around the analytics so I built something similar in Next.js with very little effort.
I'm using it on my side projects and it works great for my needs. It provides essential insights without the complexity of full-fledged analytics platforms.
The goal
I wanted to build a simple analytics tool that:
- Accepts analytics data via a simple API
- Provides essential insights like page views, referrers, and popular lists
- Does not require cookies or personal data collection
- Easy to self-host and straightforward to use
Foundation
The idea is simple: whenever a user visits your site, a small JavaScript snippet script.js sends an event to your analytics server /api/events. The server records the event, and you can view statistics in a dashboard.
The hardest part of writing analytics tool is maintaining query performance at scale but for now scale isn’t an issue in my case. It runs on a Postgres using Neon database with Drizzle ORM schemas. For example, one can imagine tables like:

Here is each user has many websites, each website has many pageviews. pageviews table is the core of the analytics data, storing details like url, referrer, user_agent, etc.
The data is structured to allow for efficient querying of common analytics questions, such as "What are my most popular pages?" or "Where are my visitors coming from?".
Sending the tracking data
It happens on the client side on every page that executes a script.js to generate and send the required parameters. Here’s an example of one of those requests:
{
  "host": "https://ritiksharma.me",
  "path": "/",
  "referrer": "",
  "userAgent": "Mozilla/5.0 (Macintosh; Intel Mac OS X 10_15_7) AppleWebKit/537.36 (KHTML, like Gecko) Chrome/136.0.0.0 Safari/537.36",
  "screenSize": "1512x982"
}
Integration is simple. All it takes is adding a single line of code to the <head> section of your website:
<script defer src="https://analytics.ritiksharma.me/script.js"></script>Inspect the script snippet in detail on GitHub.
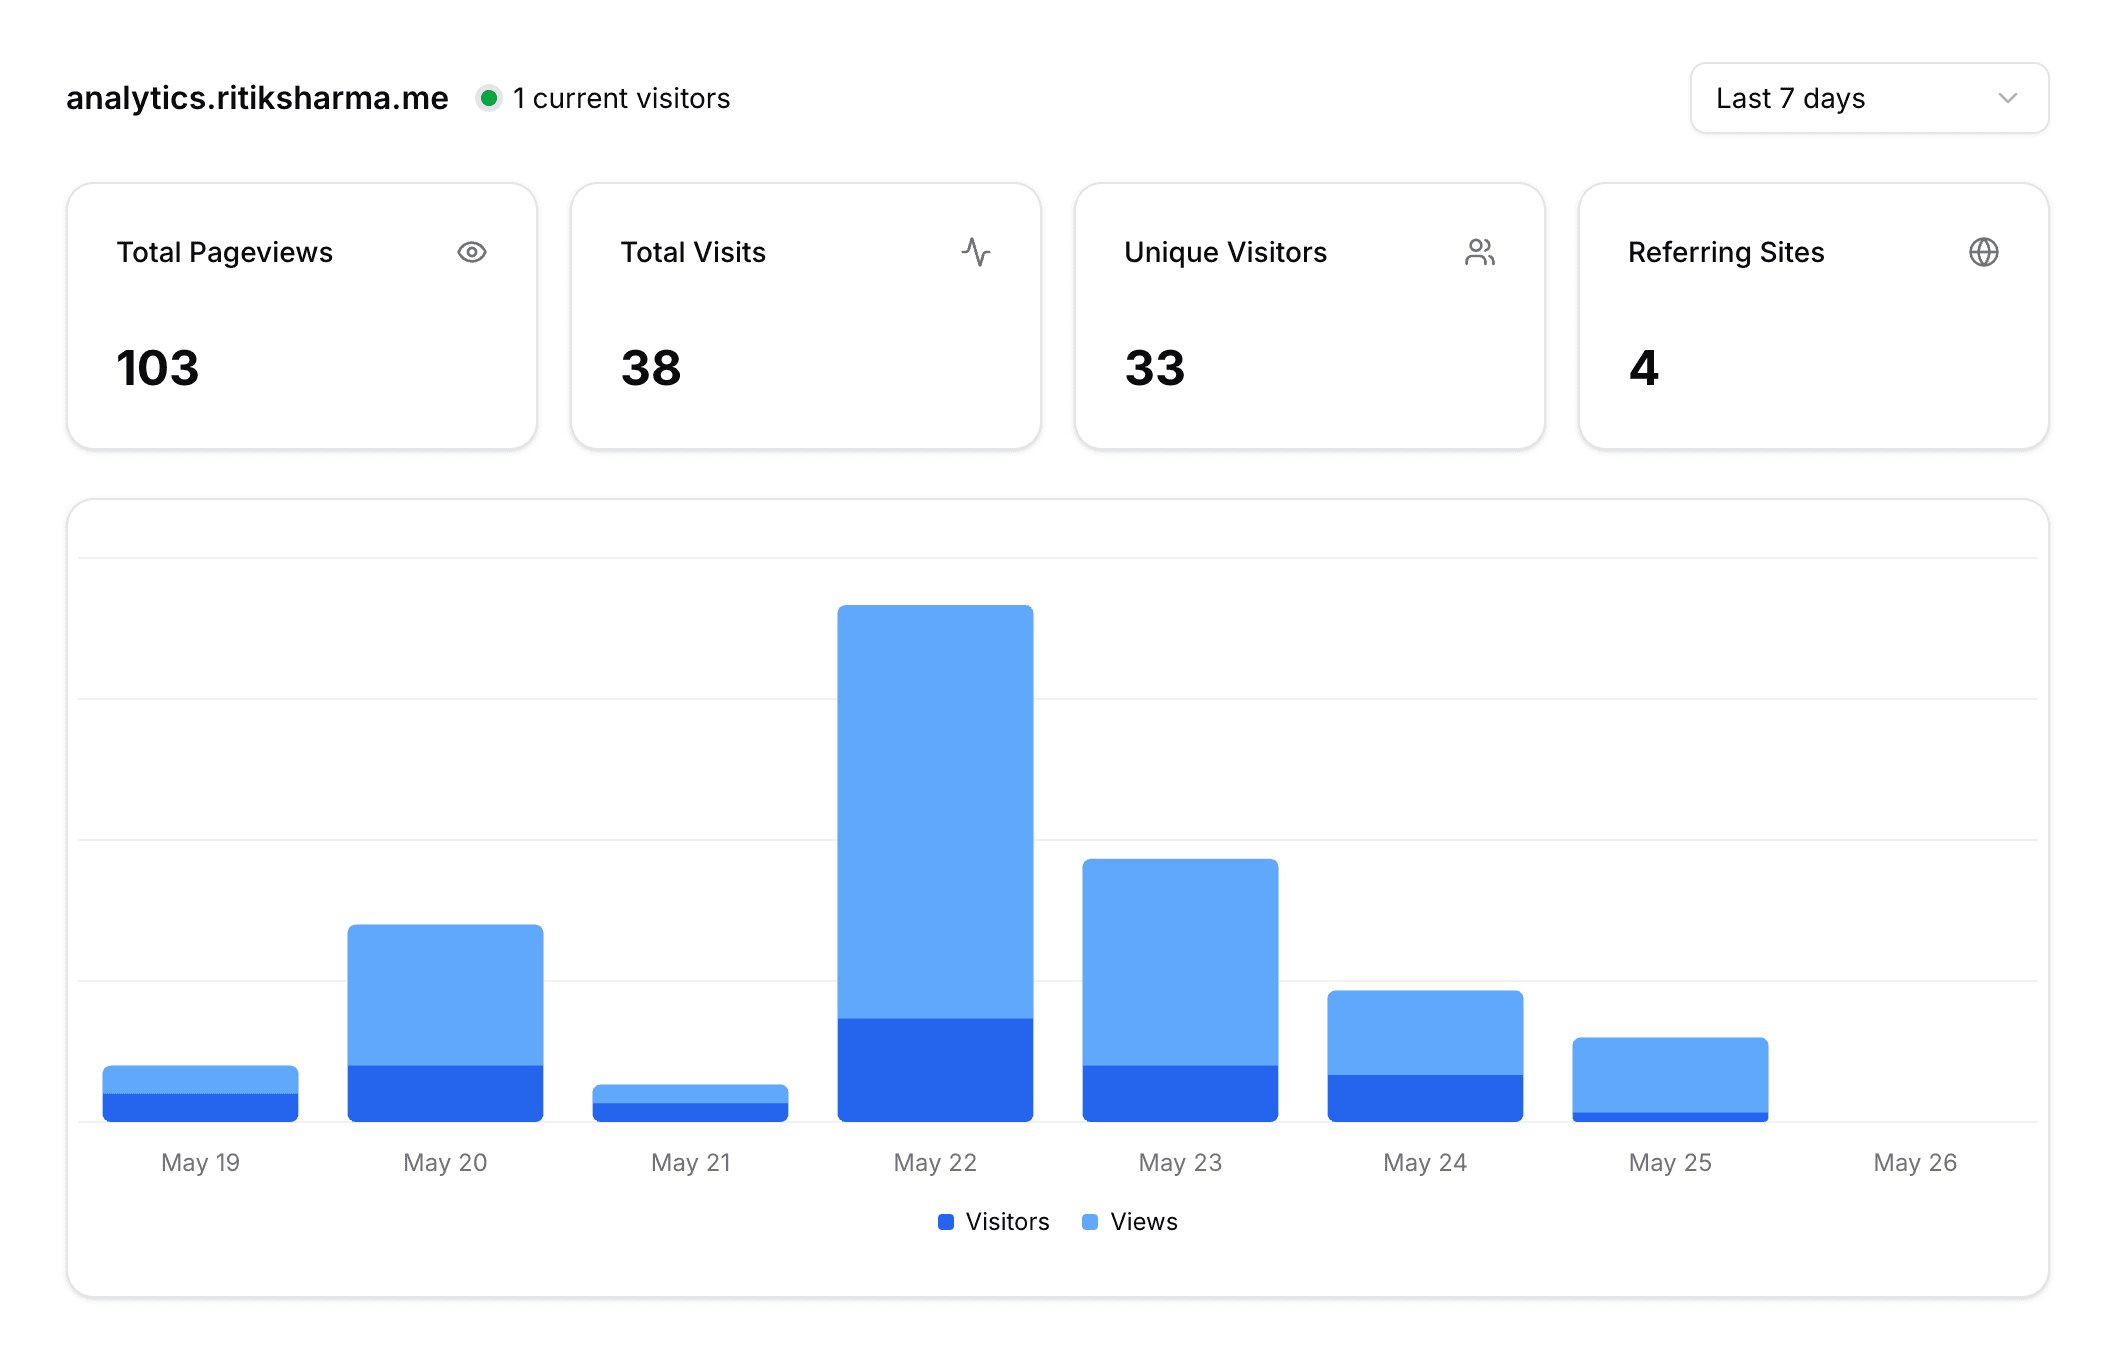
Querying popularity lists
Now that we have payload data to get ip address, browser and OS info, device type, country code, sessionId, visitId, etc. and stored in the database, we can query popular lists like:
- Top pages
- Top referrers
- Top countries
- Top Browsers
- Top devices
Here’s what the data looks like in the dashboard:

Here's how we can query the top pages using Drizzle ORM, feels like we're writing SQL queries in TypeScript.
Fetch the top 8 most viewed pages for a website within a date range (startDate, endDate), grouped by page path and ordered by view count (descending).
const pages = await db
  .select({
    page: schema.pageviews.path,
    count: count(schema.pageviews.id),
  })
  .from(schema.pageviews)
  .where(
    and(
      eq(schema.pageviews.websiteId, websiteId),
      gte(schema.pageviews.createdAt, startDate),
      lte(schema.pageviews.createdAt, endDate)
    )
  )
  .groupBy(schema.pageviews.path)
  .orderBy(desc(count(schema.pageviews.id)))
  .limit(8);
Inspect the server api events snippet in detail on GitHub.
The Why of sessionId and visitId
To understand how users use our site, it's not enough to just track page views. We need to know when a user came, how long they stayed, and what they did during that time.
That’s where sessionId and visitId come in.
- A session is a group of interactions that happen on the site within a specific time frame (month for session).
- A visit is a single interaction within that session (hour for visit).
One session can have multiple visits, and each visit can have multiple page views. For example, a user might visit your site, navigate to several pages, and then leave. All of these interactions are part of the same session but can be tracked as individual visits.

To make sense of all this, we generate two unique IDs:
sessionId: same for one user throughout the month.visitId: changes every hour, nested under that sessionId.
// generate unique session and visit id
const createdAt = new Date();
const sessionSalt = hash(startOfMonth(createdAt).toUTCString());
const visitSalt = hash(startOfHour(createdAt).toUTCString());

const sessionId = uuid(website.id, ip, clientUserAgent, sessionSalt);
const visitId = uuid(sessionId, visitSalt);
Same user, same browser, same IP, same month -> same session ID.
Uses the generated sessionId and adds the visitSalt (which changes hourly). This gives a new visitId every hour, linked to the same sessionId.
Querying live users
To see who is currently on our site, we can query the pageviews table for visits within the last 5 minutes, counting distinct sessions. This gives us a real-time count of active users.
For example, if a user views multiple pages within 5 minutes, they count as one live user since we're counting unique sessionIds:
const liveUsers = await db
  .select({ count: countDistinct(pageviews.sessionId) })
  .from(pageviews)
  .where(
    and(
      eq(pageviews.websiteId, websiteId),
      gte(pageviews.createdAt, fiveMinutesAgo)
    )
  );
Putting It All Together
Finally the time to make it live. The project is built with Next.js, TypeScript, Tailwind CSS, BetterAuth, Neon for PostgreSQL database, and deployed on Vercel.
It's designed to be lightweight (~1.2kB script), self-hostable, and easy to integrate into any website.
Check out the project on GitHub. It's open-source.
Cheers, Ritik